
Key facts
- Calculation
- Main peak area divided by total integrated peak area, times 100
- Typical detection
- UV absorbance at about 210 to 220 nm (peptide bond)
- Usual method for peptides
- Reversed-phase HPLC with a water/acetonitrile gradient
- What it measures
- Relative chromatographic purity under one stated method
- What it does not measure
- Identity, net peptide content, water, salts or counter-ions
- Best paired with
- Mass spectrometry or LC-MS for identity
What does HPLC purity mean?
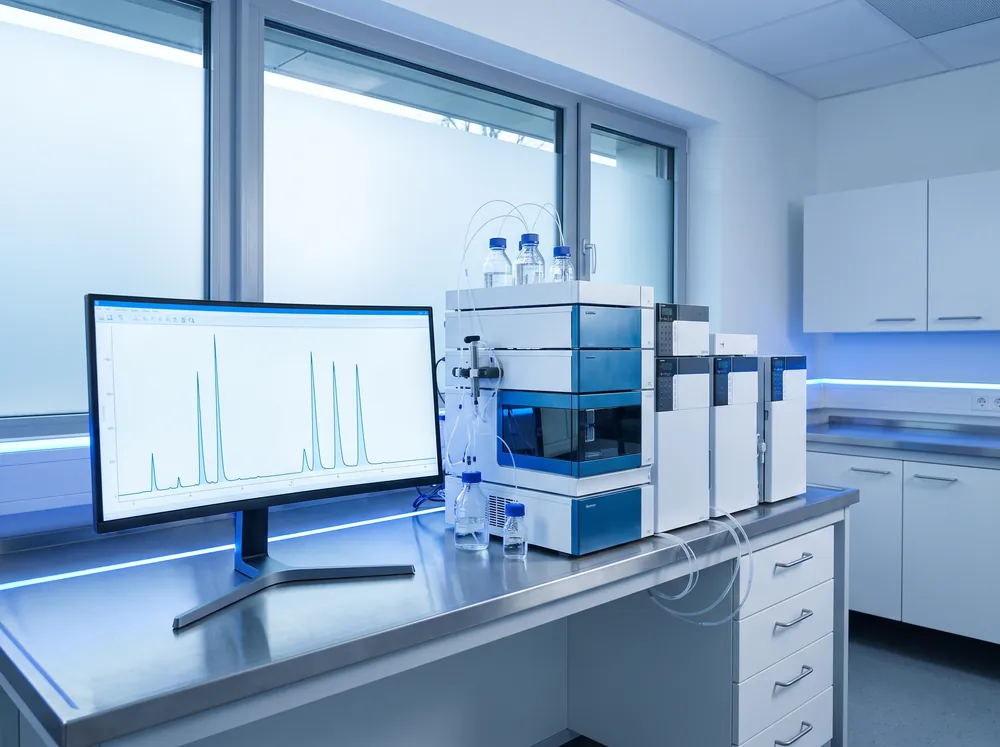
HPLC purity is a relative number. It sets the signal of the main peak against the combined signal of every peak the method detected and integrated. Those signals come from a chromatogram, the trace of detector response over time as the sample moves through the column. For synthetic peptides the standard technique is reversed-phase HPLC: as the share of organic solvent rises, components come off the column according to how strongly they cling to a hydrophobic stationary phase [1]. If you want the broader question of what purity means for peptides, counter-ions and content included, read peptide purity explained. Here we stay with the HPLC number itself.
The result is built from whatever the detector recorded, so think of HPLC purity as "chromatographic purity under these conditions". Swap the column, the gradient, the wavelength or the integration settings and the number can shift, sometimes by more than the gap between two products you're trying to compare.
How is HPLC purity calculated?
HPLC purity is calculated by dividing the main peak's area by the sum of all integrated peak areas, then multiplying by 100. Chromatographers call this the area-percent, or area-normalization, method.
| Peak | Retention time (min) | Area (mAU·s) | Area % |
|---|---|---|---|
| Impurity A | 11.8 | 120 | 1.2 |
| Main peak | 13.4 | 9,760 | 97.6 |
| Impurity B | 14.1 | 80 | 0.8 |
| Impurity C | 15.0 | 40 | 0.4 |
| Total | 10,000 | 100.0 |
For this illustrative run, the report would give an HPLC purity of 97.6%. Behind that one figure are three judgment calls. Which peaks were integrated? Where was the baseline drawn? Which stretches of the run were left out, such as the solvent front at the start or the column wash at the end? When a report includes the chromatogram and its integration table, you can see those calls for yourself instead of taking them on trust. How the instrument produces the chromatogram in the first place is covered in what HPLC testing is.
Why is HPLC purity measured at 214 nm?
Peptide HPLC purity is usually read at about 210 to 220 nm. The peptide bond itself absorbs ultraviolet light in that band, so nearly every peptide-related species shows up [1].
There's a catch that's easy to overlook: molecules don't all absorb equally. One study measured molar extinction coefficients at 214 nm and found the peptide bond at 923 M-1 cm-1, tryptophan about 30 times stronger, and phenylalanine, tyrosine and histidine about six times stronger [2]. So an impurity that has lost a tryptophan gives a smaller peak per molecule than the parent peptide, and one still carrying an aromatic protecting group may give a bigger one. Area percent is a ratio of light absorbed. It is not a ratio of molecules, or of mass.
Unless someone has determined response factors, an HPLC area percentage assumes that every component absorbs equally at the detection wavelength. For closely related peptide impurities that is often a fair approximation. It is still an approximation.
What can an HPLC purity result tell you?
It tells you how dominant one UV-absorbing component is among the components the method managed to separate and detect.
- Related impurities. Synthetic peptides can contain deletion sequences, truncated chains, residues that were never fully deprotected, oxidized forms and diastereomers from racemization. A well-developed reversed-phase method pulls many of these away from the main peak [3].
- Batch-to-batch comparison. You can compare results from different batches with each other, provided the same method produced them.
- Specification compliance. Pharmaceutical peptide specifications put limits on the main component and on individual and total impurities, each measured by a defined chromatographic method [4].
What does HPLC purity not tell you?
It won't tell you what the main peak actually is, how much peptide is in the vial, or whether something the detector can't see is present.
| Question | Answered by HPLC area %? | What answers it |
|---|---|---|
| Is the main peak the intended peptide? | No | Mass spectrometry, LC-MS, comparison with a reference standard |
| How much peptide is in the vial? | No | Net peptide content, for example by amino acid analysis |
| Are water, salts or counter-ions present? | No | Water determination, counter-ion analysis |
| Is an impurity hiding under the main peak? | Not reliably | A second, orthogonal HPLC method, LC-MS or diode-array peak checks |
| Are resolved related impurities above a limit? | Yes | The same validated HPLC method |
The biggest blind spot is co-elution. When an impurity comes off at nearly the same retention time as the target, it gets integrated into the main peak and quietly pushes the purity figure up. Adding a mass spectrometer after the column helps, because two species sharing a retention time often differ in mass. One LC-high-resolution MS study of synthetic oxytocin used exactly this approach to identify and quantify structurally related impurities [5]. It's also why identity and purity are handled as separate questions, as explained in identity vs. purity in analytical testing.
Counter-ions cause the other common mix-up. Peptides purified by reversed-phase HPLC often come out as trifluoroacetate or acetate salts, and freeze-dried powder holds some residual water as well. Both add weight to the powder but never enter the area-percent calculation. That's how a 99% HPLC purity result can sit next to a net peptide content well under 99% [1][3].
What does 98% or 99% HPLC purity mean?
A 99% HPLC purity result means that, under the stated method, 1% of the integrated UV signal came from peaks other than the main one.
Putting one supplier's 98% next to another's 99% only means something if the two values came from comparable methods. A shallow gradient on a high-efficiency column can separate small impurities that a fast, steep gradient folds into the main peak. So a lower number from a demanding method can describe a cleaner sample than a higher number from a quick screen. Pharmacopeial reference standards exist partly to anchor comparisons like these [6]. Before you compare figures, check five things:
- Which column, mobile phase and gradient were used?
- What detection wavelength was used?
- Is the chromatogram shown, with retention times and an integration table?
- Which batch or lot does the result belong to, and when was it tested?
- Was identity confirmed separately, for example by mass spectrometry?
How HPLC purity should appear on a COA
On a certificate of analysis, HPLC purity should be a percentage tied to a named method, a batch number and a test date, ideally with the chromatogram attached.
"Purity: 99%" on its own, with no method, no chromatogram and no batch link, is a claim, not a result. The field-by-field checklist in what a COA should contain shows where HPLC data belongs on the document, and how to read a COA walks you through checking it. Vinnix adds batch documentation to the COA library as each batch is released. Until a report is published, the product page says so instead of quoting a number. For how HPLC fits alongside other methods, see peptide testing.
FAQFrequently asked questions
Is HPLC purity the same as peptide content?
No. HPLC purity is the main peak's share of the UV signal among the components the method detected. Peptide content, or net peptide content, is the fraction of the powder's total weight that is actually peptide once you account for water, salts and counter-ions like trifluoroacetate or acetate. Since the purity calculation barely sees those components, a sample can show 99% HPLC purity and still have a noticeably lower net peptide content.
Does HPLC purity confirm the identity of a peptide?
No. HPLC shows that one component dominates the chromatogram, but it doesn't say what that component is. A different peptide, or a sequence isomer, could give a single clean peak just as easily. Identity is normally confirmed by mass spectrometry, which measures molecular mass, or by matching the sample to a reference standard. A complete analytical record reports identity and purity as separate results.
Why might two labs report different HPLC purity for the same batch?
Because HPLC purity depends on the method. Columns, gradients, wavelengths and integration settings all separate and count impurities differently. A slower gradient might resolve an impurity that a faster one merges into the main peak, and the reported purity drops accordingly. Results are only directly comparable when they come from the same method, or one shown to be equivalent. That's why a COA should name its method.
What wavelength is used for peptide HPLC purity?
Most peptide purity methods detect somewhere around 210 to 220 nm, often at 214 or 220 nm, since the peptide bond absorbs ultraviolet light there and nearly every peptide species becomes visible. Some methods add a second wavelength, such as 280 nm, where tryptophan and tyrosine absorb, to help characterize peaks. The report should state the wavelength, because it changes the relative peak areas.
Can an impurity hide under the main HPLC peak?
Yes. An impurity with almost the same retention time as the target peptide co-elutes, gets integrated as part of the main peak, and makes the purity look better than it is. Analysts cut that risk by running a second method with different selectivity, checking peak spectra with a diode-array detector, or switching to LC-MS, where co-eluting species can often be told apart by mass.
Is a higher HPLC purity always better?
Only when the methods are comparable. A 99% result from a short screening gradient isn't necessarily cleaner than 97% from a high-resolution method that pulls out more impurities. Before comparing numbers, look for the method details, the chromatogram and the batch link, and make sure identity was confirmed separately by something like mass spectrometry.
REFScientific references
-
Mant CT, Chen Y, Yan Z, et al. HPLC analysis and purification of peptides. Methods Mol Biol. 2007;386:3-55. PubMed 18604941
methods review -
Kuipers BJ, Gruppen H. Prediction of molar extinction coefficients of proteins and peptides using UV absorption of the constituent amino acids at 214 nm to enable quantitative reverse phase high-performance liquid chromatography-mass spectrometry analysis. J Agric Food Chem. 2007;55(14):5445-51. PubMed 17539659
analytical method study -
D'Hondt M, Bracke N, Taevernier L, et al. Related impurities in peptide medicines. J Pharm Biomed Anal. 2014;101:2-30. PubMed 25044089
review -
Vergote V, Burvenich C, Van de Wiele C, et al. Quality specifications for peptide drugs: a regulatory-pharmaceutical approach. J Pept Sci. 2009;15(11):697-710. PubMed 19750489
review (pharmacopeial specifications) -
Li M, Josephs RD, Daireaux A, et al. Structurally related peptide impurity identification and accurate quantification for synthetic oxytocin by liquid chromatography-high-resolution mass spectrometry. Anal Bioanal Chem. 2021;413(7):1861-1870. PubMed 33479819
analytical method study -
McCarthy D, Han Y, Carrick K, et al. Reference Standards to Support Quality of Synthetic Peptide Therapeutics. Pharm Res. 2023;40(6):1317-1328. PubMed 36949371
review (pharmacopeial reference standards)
 Research Library
 Research Library
 Testing & Analysis