
Key facts
- Horizontal axis
- Retention time, in minutes
- Vertical axis
- Detector response, often mAU at 214 to 220 nm
- Main peak
- The target peptide
- Area % purity
- Main peak area / total integrated area x 100
- Baseline separation
- Resolution (Rs) of about 1.5 or more
- Ideal peak shape
- Symmetrical, tailing factor close to 1.0
What is an HPLC chromatogram?
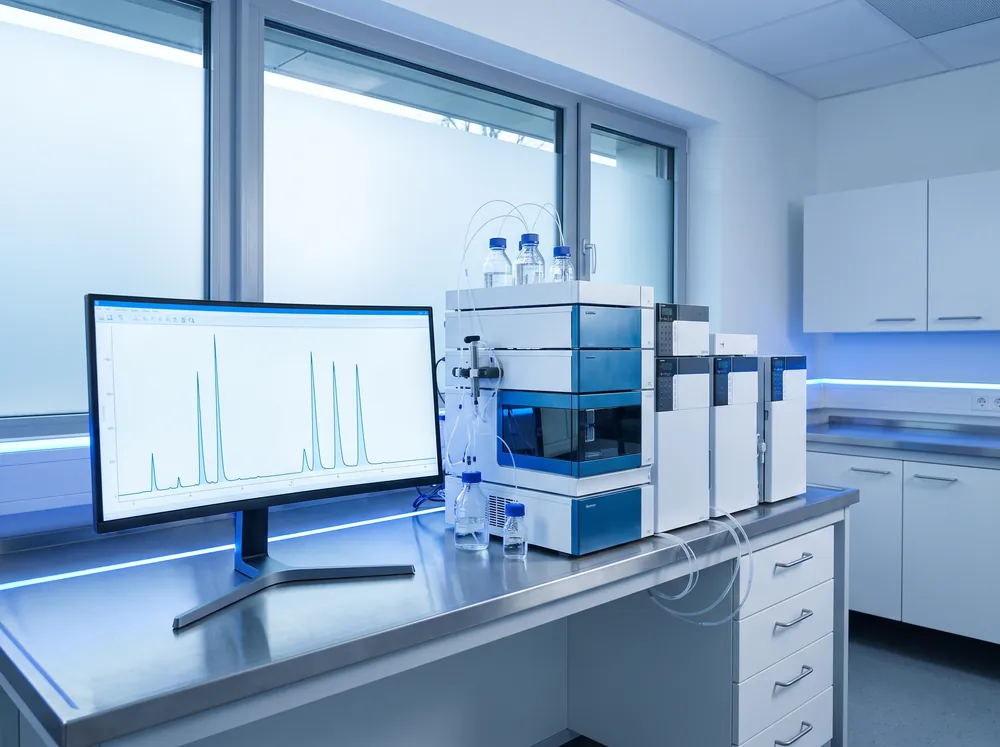
An HPLC chromatogram is simply the graph the system draws: detector signal traced across the length of the run. While nothing is eluting, the line sits flat along a baseline. When a component passes the detector, the line climbs and falls back, and that bump is a peak.
Peptide chromatograms usually come from reversed-phase HPLC with UV detection near 214 nm [1]. The mechanics of the run are covered in how does HPLC work. Here the focus is on reading what comes out.
Step 1: Read the axes and run conditions
First, the axes. Retention time in minutes runs along the bottom. Up the side is detector response, usually in milli-absorbance units (mAU) at a stated wavelength.
Then the header or method block. A good HPLC chromatogram names the sample and batch, the column, the gradient, the detection wavelength and the run date. Without those details you can't compare its peaks with any other run. The same logic applies to the report as a whole, as how to read a COA explains.
Step 2: Find the baseline and the early signals
Now check the baseline and the first minute or two. Wiggles near the start are usually unretained material, things like sample solvent or salts that pass straight through the column. They are rarely peptide impurities.
Gradient methods often make the baseline drift up or down as the solvent mix shifts. To handle this, laboratories run a blank (a sample with no peptide) under the same method, then recognize system peaks and drift and leave them out of integration. When a report mentions a blank comparison, that's a good sign.
Step 3: Identify the main peak
Usually the biggest peak is the main peak, and it stands for the target peptide. Its retention time should line up with a reference standard run under the same method; pharmacopeial reference standards exist for exactly this job [4].
A match helps, but it isn't proof. Other compounds can elute at almost the same time. Identity is normally confirmed by mass spectrometry, and that's why the better reports carry both methods.
Step 4: Look at the smaller peaks
The smaller peaks are other components that absorb UV. In synthetic peptides, most are related impurities, molecules that look a lot like the target [2]. Being so similar, many of them come off just before or just after the main peak.
| Impurity type | Origin | Typical chromatographic behavior |
|---|---|---|
| Deletion sequences | One residue missed during synthesis | Often close to the main peak, either side |
| Truncated sequences | Chain growth stopped early | Can be well separated if much shorter |
| Oxidized forms | Methionine or tryptophan oxidation | Methionine sulfoxide is more polar and usually elutes earlier |
| Deamidated forms | Asparagine or glutamine converted to acid | Small shift; may appear as a shoulder |
| Diastereomers | Racemization of one residue | Very close to the main peak |
| Incompletely deprotected forms | Protecting group left on | Usually more hydrophobic, later eluting |
Methionine-containing peptides deserve a closer look for oxidation-related peaks; MOTS-c, with two methionine residues, is a good example. Pharmacopeial texts for peptide substances set thresholds above which related impurities have to be reported, identified or qualified [3].
Step 5: Check the integration and area percentage
To get HPLC purity, divide the main peak's area by the total area of every integrated peak and multiply by 100. The peak table printed below the HPLC chromatogram gives you the numbers behind that sum.
| Peak | Retention time (min) | Area (mAU x s) | Area % |
|---|---|---|---|
| 1 | 7.85 | 1,250 | 1.25 |
| 2 (main) | 9.42 | 96,400 | 96.40 |
| 3 | 9.71 | 1,880 | 1.88 |
| 4 | 11.06 | 470 | 0.47 |
| Total | 100,000 | 100.00 |
Here the main peak has 96,400 of 100,000 area units, so the reported purity is 96.40%. But integration choices move that number. Where the baseline is drawn, the smallest peak that gets counted, whether a shoulder is split off from the main peak: each of these shifts the result. A careful report states its integration settings, or at the very least its reporting threshold. For what the percentage does and doesn't mean, see peptide purity.
Step 6: Judge peak shape and separation
Peak shape tells you whether to trust the separation. You want a narrow, nearly symmetrical main peak, with the trace dropping back to baseline between neighboring peaks.
- Resolution. A resolution value of about 1.5 or more between two peaks means they are separated to baseline.
- Tailing. A peak that drags out on its trailing side has a tailing factor above 1; heavy tailing can hide small impurities underneath it.
- Shoulders. A bump on the side of a peak usually means a second component is only partly separated.
- Co-elution. Two components can elute together as one peak. Photodiode array spectra or LC-MS can reveal this.
What a chromatogram cannot tell you
An HPLC chromatogram can only show what the detector responds to under the method used. Some things it simply can't see.
- Identity. Retention time alone does not confirm the molecule; see HPLC vs. mass spectrometry.
- Quantity. Area percentage is a ratio, not an amount. Water and counter-ions do not appear as peaks, so purity is different from net peptide content.
- Different response. Impurities do not all absorb UV light equally, so area percentages are approximations of relative amounts [2].
- Hidden components. Anything that co-elutes with the main peak, or does not absorb at the chosen wavelength, is not counted.
To see where chromatograms fit in the full batch documentation, read the certificate of analysis overview and peptide testing.
FAQFrequently asked questions
What do the peaks on an HPLC chromatogram mean?
A peak is a component of the sample reaching the detector at a particular moment. Where it sits on the time axis is its retention time, and the area under it reflects how much signal that component gave. In a peptide HPLC chromatogram, the biggest peak is normally the target peptide, and the small ones are impurities or related substances.
What is retention time?
It's the time from the start of the run to the top of a component's peak. Under fixed method conditions, a given compound comes off at a consistent retention time, which is how peaks get recognized and compared with a reference standard. Different compounds can elute at almost the same time, though, so retention time supports identity without proving it.
How is HPLC purity calculated from a chromatogram?
Usually as area percent: the main peak's area divided by the total area of all integrated peaks, times 100. So if the main peak has 96,400 area units out of 100,000 total, purity is 96.4%. The method, wavelength and integration settings all affect the answer, which is why a report should state them.
Why are there small peaks near the main peak?
They're usually related impurities, molecules very close to the target peptide. Think sequences missing one amino acid, oxidized or deamidated forms, and diastereomers. Their structure and hydrophobicity are near enough to the target's that they elute at similar times. An HPLC purity figure is essentially a summary of how big and how many these peaks are.
What does a shoulder on an HPLC peak mean?
A shoulder is a bump or kink on the side of a peak. Most of the time it means a second component is eluting very close to the first and hasn't fully separated. It can change the purity result, depending on whether the software integrates it on its own or as part of the main peak. A different gradient or column, or LC-MS, can help pull it apart.
Does a single peak mean a sample is pure?
Not necessarily. One peak means nothing else was separated and detected under that method. Impurities might co-elute with the main peak or absorb poorly at the chosen wavelength, and non-peptide components such as water and salts never show up in HPLC at all. A single peak is good evidence of chromatographic purity, not of full composition or identity.
What does mAU mean on a chromatogram?
Milli-absorbance units, the unit a UV detector uses for its signal; one mAU is a thousandth of an absorbance unit. How tall a peak is in mAU depends on how much of the component is present and how strongly it absorbs at the detection wavelength. For peptides that wavelength is usually 214 to 220 nm.
REFScientific references
-
Mant CT, Chen Y, Yan Z, et al. HPLC analysis and purification of peptides. Methods Mol Biol. 2007;386:3-55. PubMed 18604941
methods review -
D'Hondt M, Bracke N, Taevernier L, et al. Related impurities in peptide medicines. J Pharm Biomed Anal. 2014;101:2-30. PubMed 25044089
review -
Vergote V, Burvenich C, Van de Wiele C, De Spiegeleer B. Quality specifications for peptide drugs: a regulatory-pharmaceutical approach. J Pept Sci. 2009;15(11):697-710. PubMed 19750489
review (pharmacopeial specifications) -
McCarthy D, Han Y, Carrick K, et al. Reference standards to support quality of synthetic peptide therapeutics. Pharm Res. 2023;40(6):1317-1328. PubMed 36949371
review (pharmacopeial reference standards)
 Research Library
 Testing & Analysis